AIA
Engineering
The lowest-cost maker of high-chrome grinding media, trading at its cheapest multiple in ten years.
Applied Value Investing, IIM Ahmedabad. Faculty: Prof. A. N. Seshadri.
We recommend buying AIA at ₹3,196, with a three-year base-case target of ₹4,334.
The probability-weighted value is ₹4,194. The base case earns our 12% hurdle at ₹3,140 or lower, and the stock traded at ₹3,081 on 9 November.
Demand for grinding media keeps growing Part 1
Mines grind more rock as copper grades fall, and mining media is still 70–75% forged steel. Molycop, the forged leader, is itself building high chrome.
AIA has the best economics in its industry Part 2
₹48,700 of EBITDA per tonne, four times Molycop's, a 26% operating margin and a 35% median pre-tax return on tangible capital, with no debt.
The volume trough is behind it Parts 3–4
Duties took 75–80 kt and are now in the base. The order book is a record ₹1,071 Cr, mining tonnes are rising and 178 kt of capacity is idle.
The price assumes almost none of this Part 5
₹3,196 implies 7.7% volume growth, against a 10% management plan, at 28.7x earnings excluding cash, the bottom of a ten-year range.
Will demand for AIA's products keep growing?
Comminution uses up to half of a mine's energy, and the steel balls and liners inside the mills wear out every day. We look at how much rock the world will need to grind, and whether that rock will be ground with AIA's product.
- 1IndustryWill demand for AIA's products keep growing?
- 2CompanyDoes AIA have a lasting edge?
- 3Why nowWhy has volume been flat, and why will that change?
- 4ManagementCan management deliver?
- 5ValuationWhat is the price assuming?
- 6RisksWhat would prove us wrong?
- 7ScuttlebuttWhat does the trade tell us?
AIA sells the parts that wear out inside the SAG and ball mills, where most of a concentrator’s energy goes.
Mine
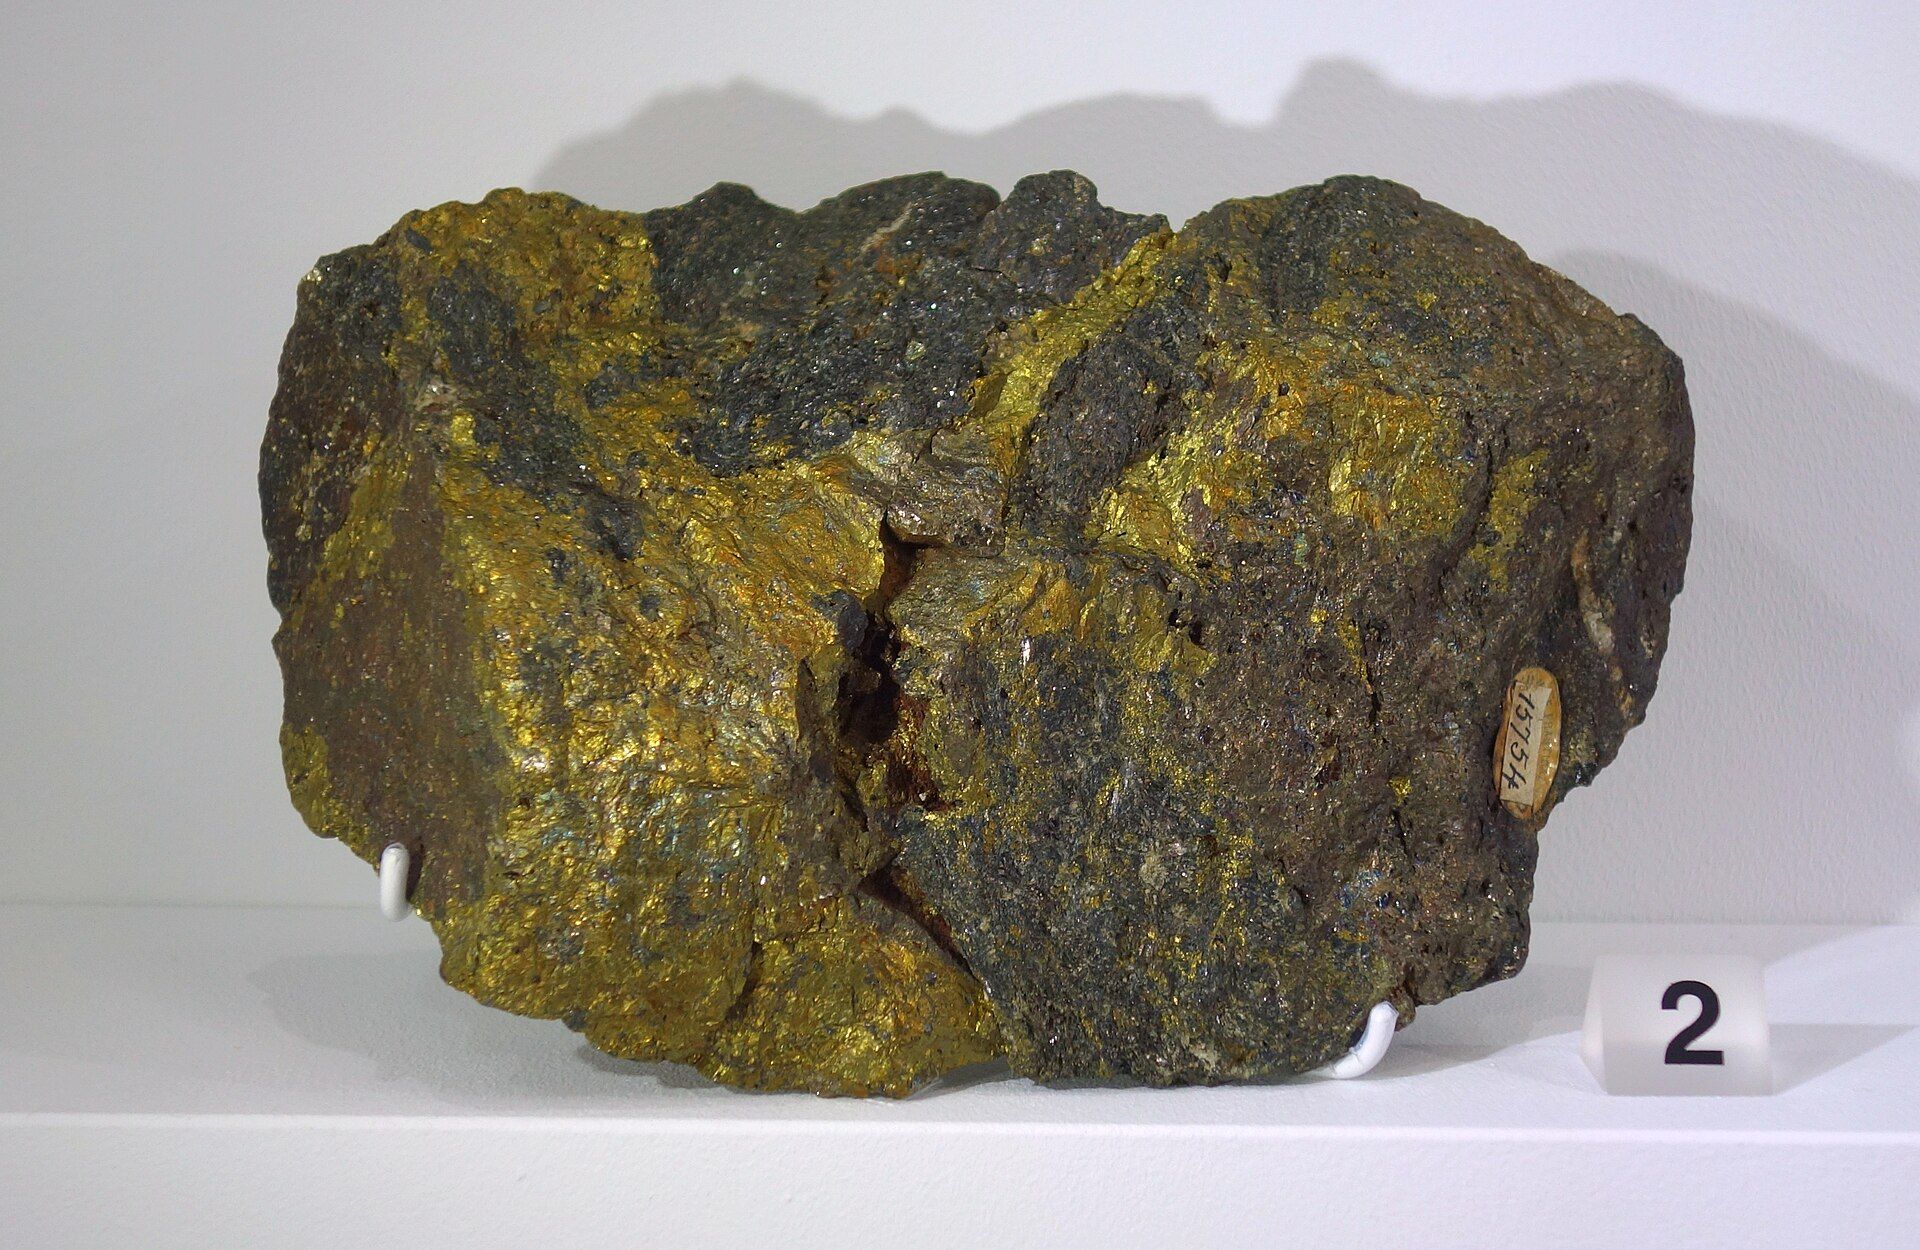
Ore at 0.5–0.6% copper: about 167 t of rock for each tonne of metal.
Crush
Primary crushers break rock to under 200 mm. AIA sells crusher wear parts here.
SAG mill
The rock grinds itself. Its 130–160 mm balls are usually forged, because high chrome can crack; AIA sells liners and discharge systems here.
Ball mill
Smaller balls grind ore to about 150 microns. This is where high chrome replaces forged steel.
Flotation
Reagents separate the copper. Iron from worn balls lowers recovery.
Concentrate
Shipped to smelters at 25–30% copper.
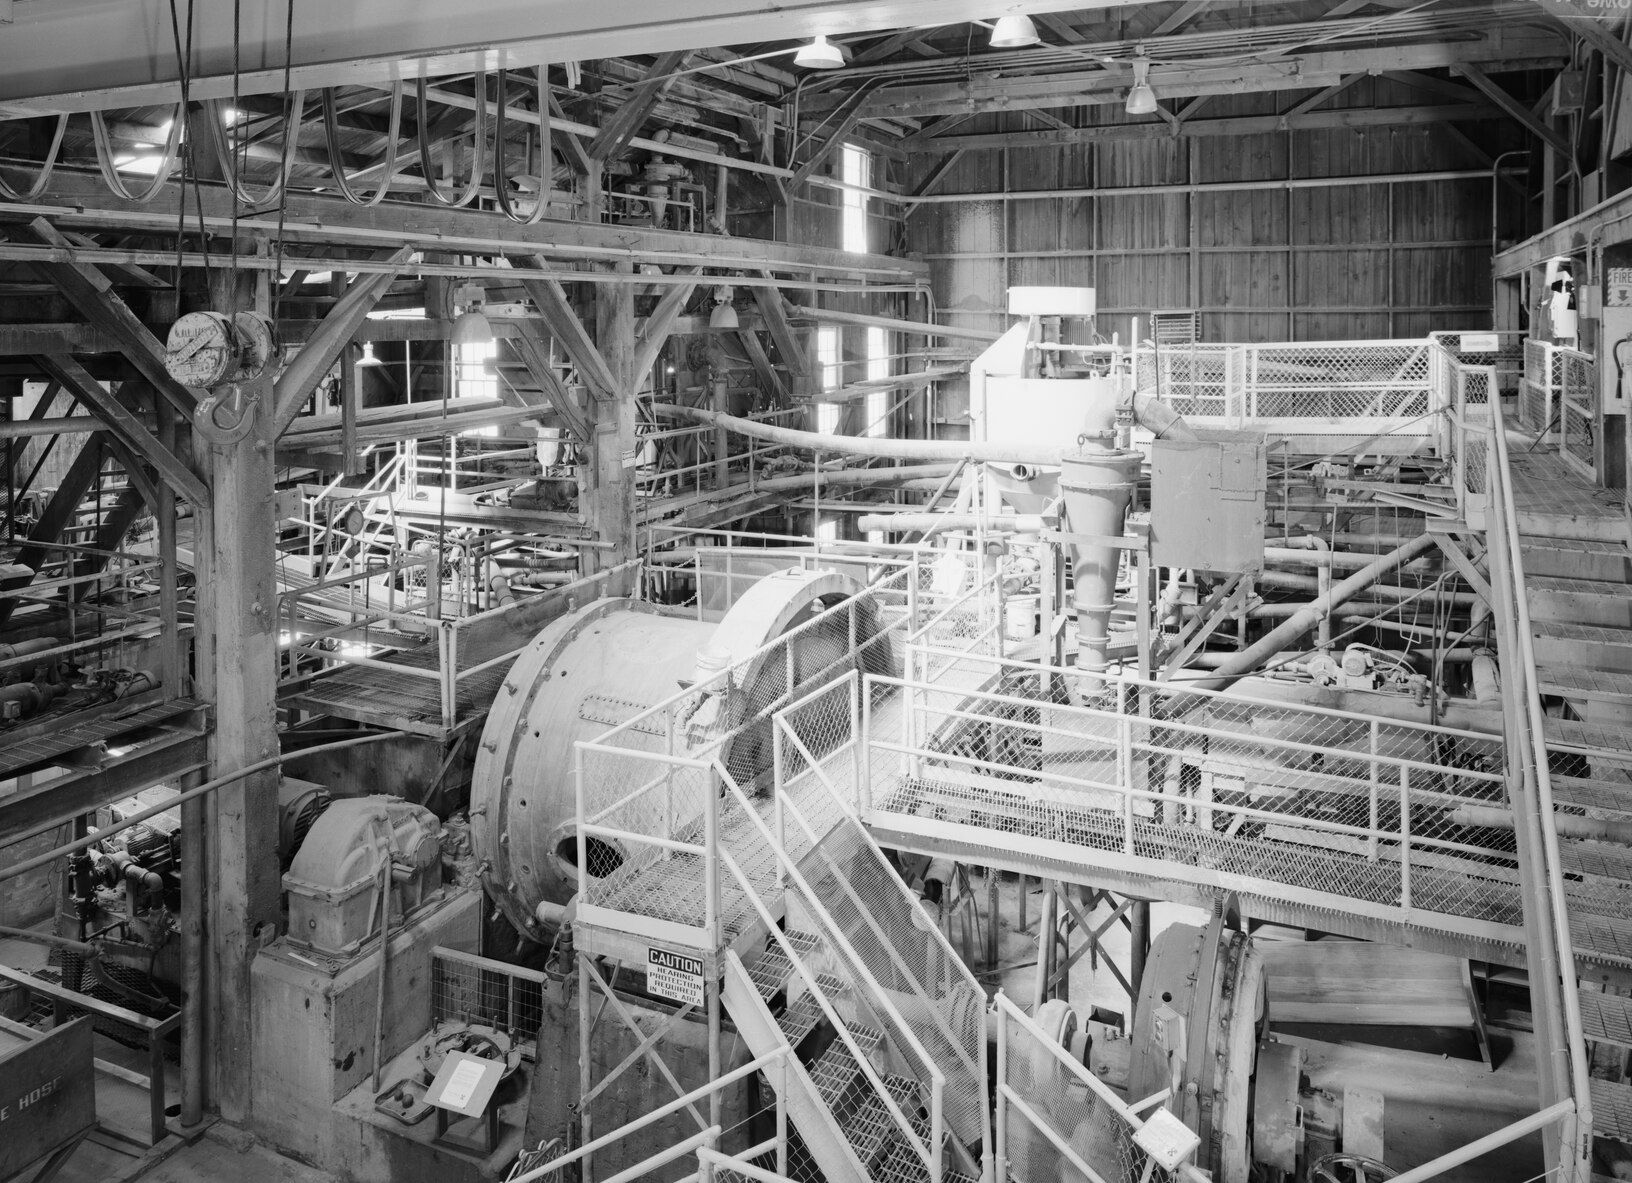
Balls wear by abrasion and corrosion, and mines top them up every day. Shell liners last 6 to 18 months. AIA used to sell these items separately; since 2025 it sells liners, its discharge system and media as one package for a mill.
Consumption is measured in grams of steel per tonne of ore, so demand follows how much rock a mine processes, whatever its capex budget. High-chrome iron resists corrosion in wet slurry. It wears 25–50% less than forged steel and leaves less iron to interfere with flotation.
As ore grades fall, mines grind more rock for each tonne of copper, and use more media.
At a 1% grade, a mine grinds 100 t of rock for each tonne of copper.
The IEA estimates average copper ore grade has fallen about 40% since 1991. ICSG data show world mine output fell 1.1% in the first half of 2026, while LME copper reached a record US$14,533/t on 7 September. Mines are short of throughput, and they need more grinding to get it.
Use the right arrow key to lower the grade from 1.0% to 0.6% and then 0.5%.
The pit keeps getting bigger to produce the same copper.
As grades fall, Escondida moves and grinds more rock for each tonne of metal. This year that stopped being enough to hold output steady.
Chile’s 2026 output is now seen falling 8.4% to 4.94 Mt. BHP’s Escondida and Spence and Codelco’s mines explain over 77% of the drop, with Cochilco citing “lower ore grades, maintenance and disruptions.”
The 2026 news flow on copper supports the throughput argument: high prices, falling grades and mines that cannot keep up.
Cochilco pushed Chile’s 6 Mt peak out by several years, citing falling ore grades. The 2027 forecast fell from 6.07 Mt to 5.97 Mt.
A record price while ICSG data showed world mine output down 1.1% in the first half of 2026.
The headline from the industry’s main annual meeting in London sums up the year: demand is there, mine supply is not.
Chilean output fell 8.5% in January to September. Fewer tonnes milled in 2026 means less media used this year.
Lower grades mean more rock blasted, hauled and ground for each tonne of copper produced.
Copper has more than doubled since 2020, and the IEA expects mine supply to fall 30% short of demand by 2035.
IEA: the current mine pipeline leaves copper supply about 30% short of demand by 2035, because of falling grades, rising costs and long lead times.
ICSG (Oct 2025): the refined market swings from a 2025 surplus to a 2026 deficit of about 150,000 t.
World mine output fell in H1 2026 (ICSG), and Chile now expects an 8.4% fall for the year.
Refined usage still grows each year (ICSG), driven by grids, electric vehicles and data centres.
Cement converted to high chrome decades ago. Mining uses over 2 Mt of media a year and is still 70–75% forged steel.
A mature, fully converted market where AIA is the default supplier. It generates cash but will not drive growth.
Vertical-mill parts for coal pulverisers. The FY26 annual report expects more demand as India adds power for data centres.
Only 25–30% is high chrome. AIA sells about 160 kt into mining, roughly 8% of the pool. The largest SAG-mill balls stay forged, so the convertible pool is smaller than 2 Mt.
India will add 245–255 Mt a year of cement capacity by FY31, and AIA supplies over 95% of Indian plants.
Installed capacity by FY31, from about 720 Mt today.
Cement demand growth a year over FY27–31, led by infrastructure.
Expected utilisation, against a ~68% average over the last decade.
High-chrome media costs about twice as much per tonne as forged steel, and wears 30–80% less in ball mills.
| Source | Setting | Result against forged steel |
|---|---|---|
| Wear-rate literature | Ball mills, general | 25–30% less wear; up to 50% less in corrosive circuits |
| Kagara, Mount Garnet | Copper-zinc concentrator, Australia | Wear under a third of forged; better grade and recovery |
| AIA case study | 19 Mtpa copper mine, Philippines | 31% less media used and 18% less power per tonne after a full package retrofit |
| Price | AIA realisation against a US forged benchmark | About US$1,900/t against US$970/t |
| Vega veteran (our interview) | Ball mills, many sites | 50–80% less wear, e.g. 650 → 300–350 g/t |
| Counter-evidence | SAG mills with 130–160 mm balls | High chrome can crack under impact; forged stays |
Why mines are slow to switch
Our interview mapped the steps: a marked-ball test, a baseline negotiation, 2–4 months to ship, a 3–6 month purge and 3–6 months of monitoring. About a year in all, and a full mill charge costs 600–1,200 t of steel.
What AIA changed in 2025–26
AIA now sells mill throughput instead of a lower wear rate. The package combines liners, its Next Generation Discharge System (NGDS) and media, and management says it targets at least a 15% throughput gain. With copper above US$14,000/t, a mine values extra tonnes far more than cheaper balls.
In mining, buyers hold the power until a site converts. After that, switching back costs the mine a new trial.
| Force | Strength | Evidence |
|---|---|---|
| Buyers | High | Global miners buy by tender after trials, on 12–18 month contracts. |
| Substitutes | High, falling | Forged steel holds 70–75% of mining, but its leader is adding high chrome. |
| Rivalry | Medium | Molycop (Tega and Apollo), Magotteaux (Sigdo Koppers), ME Elecmetal, about 20 Chinese forgers; low in cement. |
| Suppliers | Medium | Scrap and ferro-chrome are 38–41% of sales, passed through with a 3–6 month lag. |
| New entrants | Low | Anyone can cast balls. Custom metallurgy, mill design and trial references take years to build. |
What this means for AIA
Once a site runs on AIA liners and media, the mill’s operating settings are tuned to them, and changing back means another trial. AIA has to win its position mine by mine. That makes growth lumpy, but the business it wins tends to stay.
Molycop, the largest forged-ball maker, is building high-chrome capacity. The demand AIA is chasing is real.
Tega Industries and Apollo agree to buy Molycop at a US$1.48 bn enterprise value.
FY25 multiple. Molycop had ₹13,520 Cr of sales at an 11.2% margin.
The deal closes. Molycop runs at about 1.25 Mt a year, at a 14% margin in Q2 FY27.
| From Tega’s earnings calls | Tonnes |
|---|---|
| Forged capacity, about 70% used | 1.7 Mt |
| Own high-chrome capacity, fully used | 20 kt |
| High chrome bought from other suppliers each year | about 60 kt |
| High-chrome capacity target | 200 kt |
The world’s largest forged supplier already buys 60 kt of high chrome from others and plans to build ten times its own capacity. The open question for AIA is market share, since the demand is there.
Does AIA have a lasting edge?
A 48-year-old Ahmedabad foundry with 436 kt of capacity, no debt and its founder in charge. We test whether its returns come from a lasting advantage or a good cycle.
- 1IndustryYes. Mines grind more rock as grades fall, and mining media is still 70–75% forged steel.
- 2CompanyDoes AIA have a lasting edge?
- 3Why nowWhy has volume been flat, and why will that change?
- 4ManagementCan management deliver?
- 5ValuationWhat is the price assuming?
- 6RisksWhat would prove us wrong?
- 7ScuttlebuttWhat does the trade tell us?
AIA sells 65% of its output abroad, from three plant clusters around Ahmedabad.
Founded; wear parts for cement and power plants.
Starts making high-chrome grinding media.
Vega ME set up as global distributor; listed in 2005.
Mining-liner plant opens and the push into mining starts.
Kerala GIDC greenfield plant; capacity passes 4 lakh t.
Rubber and composite liners; US$32.9 mn order from a Chilean copper mine.
Liners, NGDS and media sold as one package.
Grinding media make up about three quarters of tonnes. The rest is mill liners, NGDS discharge systems, vertical-mill parts and crusher parts.
The plants are at Moraiya, Odhav and Kerala GIDC near Ahmedabad, backed by more than 10 overseas warehouses. Captive wind and solar will supply 60–65% of power.
Promoters own 58.5%, unchanged for seven years. Institutions own 39%, and retail investors only 2.5%.
Mining is now 62% of tonnes and exports are 64% of sales, so AIA's growth depends on mines abroad.
India ₹1,613 Cr; exports ₹2,807 Cr. Exports are billed mostly in US dollars, with some Australian dollar and Brazilian real.
Mining 160 kt and other markets 98 kt. Mining was 166 kt in FY25 and 79 kt in H1 FY27.
About three quarters grinding media and a quarter liners and castings (Aug 2026 call). Liners earn more per kilogram.
AIA sells to the largest names in mining and cement, and buys from Indian steel and ferro-alloy producers.
- Newmont
- Anglo American
- Vale
- ArcelorMittal
- Pucobre (Chilean copper)
- A large Chilean copper mine (US$32.9 mn order, Oct 2025)
- UltraTech
- Ambuja and ACC
- Grasim
- Holcim and Lafarge
- Heidelberg Materials
- CEMEX, Votorantim
- FLSmidth
- Kawasaki Heavy Industries
- Hitachi
- Alstom
- Larsen & Toubro
- Indian coal-fired power plants
Suppliers
Tata Steel (steel scrap and inputs), Indian Metals & Ferro Alloys (ferro-chrome), and Harsha Engineers, a related party. 88% of inputs are sourced in India.
Selling through Vega
Most export sales are billed through Vega Industries (Middle East), AIA's own distribution subsidiary in the UAE, which is why it appears as the largest customer in databases.
Revenue doubled from FY19 to FY23, then slipped as duties and shipping disruption hit exports. Margins held up.
FY23 combined a 23% rise in realisation with 12% more volume. In FY25 revenue fell 12% as US duties began and the Red Sea route closed, yet the operating margin went up. Raw-material costs are passed through, so the margin depends on pricing, and AIA’s pricing held.
From ₹171 of revenue per kilogram, AIA keeps ₹49 as operating EBITDA. Raw materials are the only large cost.
Scrap and ferro-chrome make up 38% of sales and are passed on through price-variation clauses with a three to six month lag. That is why the margin held when raw-material prices spiked.
Freight, at ₹13 a kilogram or 7.8% of sales in FY26, is the cost that moves with geopolitics. It reached about 10% in Q2 FY27 and cost 2.5–3 points of margin.
Staff cost is ₹7.7 a kilogram, 4.5% of sales. A forged-ball plant next to a mine in Chile pays far more for labour and power, which is how AIA can absorb freight and duties and still earn ₹49 a kilogram.
Input prices swung by a third in five years. AIA's price per kilogram followed, and the margin recovered within a year.
| Year | ₹/kg | Op. margin |
|---|---|---|
| FY22 | 137 | 20.2% |
| FY23 | 169 | 25.3% |
| FY24 | 163 | 27.5% |
| FY25 | 168 | 26.8% |
| FY26 | 171 | 28.4% |
| H1 FY27 | 178 | 26.5% |
The plants earn 25–40% pre-tax on tangible capital, 35% at the five-year median. Treasury income makes up 30% of reported profit, so we value it separately.
AIA has no debt and a CRISIL AA+ rating. Employee costs are under 5% of sales, and maintenance capex runs at ₹100–210 Cr a year.
Other income was 30% of FY26 profit before tax. Every multiple in this deck uses core earnings, and we add the cash at book value.
FY26 operating cash flow fell to 0.47x profit as receivables reached 97 days, after stock was built for the Chile order. By Q2 FY27 receivables were down to 87 days.
Against listed mining-consumable and equipment peers, AIA earns the highest margin and return, with no debt.
AIA’s edge is low cost plus metallurgy, and it designs liners and media as one system, which rivals selling only media cannot copy.
Cost
EBITDA of ₹48,700 a tonne, about four times Molycop’s. Captive renewables save about ₹1.5 per unit of power.
Know-how
Ore testing, Bond work-index studies, charge-trajectory models and a custom alloy for each site.
Switching cost
A mill tuned to AIA liners and media needs a new one-to-two-year trial to change supplier.
Repeat demand
Media wear with every tonne milled, so orders repeat as long as the mine runs.
An overflow ball mill was converted to grate discharge using Vega’s NGDS and shell liners, with high-chrome media made for the ore.
Why using less media still helps AIA
NGDS cuts media use at a site AIA already supplies, but AIA gains the liners, which earn more per kilogram, and the mill is then built around its parts. Kunal Shah on the August call: “There is no standalone TAM… grinding media, liner and NGDS together forms a package.”
AIA's business model turns Indian casting cost and metallurgy into a per-kilogram consumable sold to mines worldwide.
Key partners
Vega subsidiaries in the UAE, Chile, Peru, Ghana, Australia, Indonesia, South Africa, the UK and the US. Scrap and ferro-chrome suppliers (88% sourced in India). Group-captive wind and solar.
Key activities
Alloy design and casting. Ore tests, site audits and mill modelling. Trials and on-site wear monitoring.
Key resources
436 kt of capacity in Ahmedabad. Metallurgists and grinding engineers. 48 years of mill references. ₹4,516 Cr of net cash.
Value proposition
Less steel worn per tonne of ore. More throughput and less power with liners and NGDS. Better flotation recovery. Two months of stock on the ground and three at sea.
Customer relationships
Long-term contracts with purchase orders against them. One-to-two-year trials before a site converts. Engineers on site.
Channels
Direct to plants in India. Overseas through Vega subsidiaries and more than 10 warehouses near mines.
Customer segments
Copper, gold and iron-ore mines (62% of tonnes). Cement plants, where AIA has over 95% of India. Coal-fired power in India.
Cost structure
Materials 38% of sales, freight 7.8%, power 6.8%, employees 4.5%. Maintenance capex of ₹100–210 Cr a year.
Revenue streams
Priced per kilogram, with clauses that pass on scrap and ferro-chrome costs. 64% exported. Export incentives of ₹64 Cr in FY26.
AIA leads on unit profit, know-how and balance sheet. It trails on scale and on plants near the mines.
| Dimension | AIA | Molycop | China | Evidence |
|---|---|---|---|---|
| Unit profit | 5 | 2 | 1 | EBITDA ₹48,700/t against about ₹12,600/t at Molycop. |
| Metallurgy and mill design | 5 | 3 | 1 | Custom alloys, NGDS and liner design; forged balls are one grade. |
| Switching cost | 4 | 3 | 1 | Converted mills are tuned to AIA parts; forged is bought on price. |
| Balance sheet | 5 | 1 | 3 | AIA net cash ₹4,516 Cr; Tega borrowings ₹11,700 Cr. |
| Scale | 2 | 5 | 4 | AIA 436 kt against Molycop's 1.7 Mt forged. |
| Plants near mines | 2 | 5 | 2 | Molycop casts in Chile, Peru, Mexico, the US and Indonesia; AIA ships from India. |
Why has volume been flat, and why will that change?
The bear case is right that volume has not grown in five years. We show what caused it, what has changed in 2026, and the modelling choice that makes the price look demanding.
- 1IndustryYes. Mines grind more rock as grades fall, and mining media is still 70–75% forged steel.
- 2CompanyYes. Four times Molycop's EBITDA per tonne, the best margins among listed peers, and liners and media tuned as one system.
- 3Why nowWhy has volume been flat, and why will that change?
- 4ManagementCan management deliver?
- 5ValuationWhat is the price assuming?
- 6RisksWhat would prove us wrong?
- 7ScuttlebuttWhat does the trade tell us?
The stock has swung between ₹3,000 and ₹5,200 on trade rulings, deals and results. The business underneath moved far less.
JM Financial upgraded the stock to Buy with a ₹3,985 target.
Adding back tonnes lost to import duties, AIA’s volume grew about 4.8% a year from FY21 to FY26.
| Market lost | When | kt |
|---|---|---|
| Canada and South Africa | Before FY22 | about 32 |
| United States (9.6% AD, 3.2% CVD, s.232) | Jun 2025 | 18–25 |
| Brazil | FY25 | 6–8 |
| Mexico (50% on most imports) | FY26–27 | under 8 |
| Management’s total | 5–7 years | 75–80 |
These losses are now in the base. The duties hit markets AIA had already won, not the copper and gold regions it is targeting: Chile, Peru, Ghana, Zambia and Australia. Kunal Shah in November: “We are at the absolute bottom.”
The order book and mining volumes turned up in 2026, before total volume did.
The ₹1,071 Cr order book covers about one quarter of sales, against half a quarter in FY21–25. Management says large new orders came in September, so this is new business and not a shipping backlog.
Mining volume rose 5.6% in H1 FY27 to 79 kt, although the Chilean customer’s mine stopped for two months in Q2. It restarted in Q3.
Management plans 25–30 kt more in each of FY28 and FY29 and says this is not guidance. Our base case uses the low end and gives no credit for NGDS.
At 59% utilisation, AIA can grow to about 370 kt without building a new plant.
Management said in August that each extra tonne earns a 60–61% gross margin once fixed costs are covered, and in May: “on these current capacities, I can easily do maybe up to 3, 3.5 lakh” tonnes. A paused brownfield line at Kerala GIDC could add 50–75 kt within 6–12 months.
That model discounts at a rupee rate but grows prices as if the rupee were stable. Made consistent, the growth required halves.
A 12% rupee cost of capital includes India’s 2.5-point interest premium over US Treasuries, which is the market’s forecast of rupee depreciation. Two thirds of AIA’s sales are priced in foreign currency, so its rupee prices rise as the rupee falls. Growing them at only 2–2.5% a year takes the cost of depreciation without the benefit.
The rupee lost 3.3% a year against the dollar over ten years and 4.6% a year over the last four. AIA’s realisation grew 5.7% a year over FY22–26. We assume 4–4.5%. With consistent inputs, the reverse DCF needs 7.7% volume growth instead of 19%.
Can management deliver?
The founder family owns 58.5%, the operators are among the best in Indian engineering, and capital allocation is cautious. We check their promises against what happened.
- 1IndustryYes. Mines grind more rock as grades fall, and mining media is still 70–75% forged steel.
- 2CompanyYes. Four times Molycop's EBITDA per tonne, the best margins among listed peers, and liners and media tuned as one system.
- 3Why nowImport duties explain the flat years. Orders and mining tonnes have turned.
- 4ManagementCan management deliver?
- 5ValuationWhat is the price assuming?
- 6RisksWhat would prove us wrong?
- 7ScuttlebuttWhat does the trade tell us?
Management runs the plants well and allocates capital cautiously. Its forecasts have become more careful.
| Area | Our grade | Evidence |
|---|---|---|
| Running the business | Strong | Operating margin of 25–29% through raw-material spikes, the Red Sea and Hormuz closures and tariffs. Margin rose in FY25 as revenue fell. |
| Delivering strategy | Mixed | Dropped the 5.2 lakh t capacity target and deferred satellite plants twice; won Chile and built a credible package offer. |
| Candour | Improving | Stopped giving dates: “we will be happy to announce growth as it happens.” The 25–30 kt plan is labelled as not guidance. |
| Capital allocation | Mixed | ₹4,500 Cr earns 7%; ₹500 Cr buyback at ₹5,000 in Sep 2024; ₹170–200 Cr for a head office. Capex is disciplined and there is no debt. |
| Alignment | Good | Promoters at 58.5% for seven years and tendered into the buyback instead of selling. MD pay is 19.5x the median employee. |
| Concerns | Watch | Chairman and MD roles combined from April 2026. Related-party sales to AB Tradelink of ₹239–301 Cr a year (6–7% of revenue). No stated succession plan. |
With only 2.5% held by retail investors, fund selling moves the price sharply. The stock fell 13% in the week of the Q2 results, and the same thin float will work in its favour when funds buy.
A founder who owns 58.5% and pays himself ₹1.1 Cr runs AIA. The open question is who comes after him.
- Founded AIA in 1978; began high-chrome media in 1985
- Holds 58.5% (5.46 Cr shares), worth ~₹17,400 Cr
- FY26 pay ₹1.10 Cr, no options or bonus; ~₹87 Cr in dividends
- Chairman too since April 2026; MD term renewed to 2031
- Leads the earnings calls; explains mining conversion, NGDS and the package offer
- Senior management, not on the board
- “We are at the absolute bottom” (Nov 2026 call)
- Co-hosts the calls; answers on capex, treasury and payout
- Audit Committee member; holds no shares
- Gave the FY27 capex range of ₹350–400 Cr
- The only other executive director; pay ₹0.30 Cr, no shares
- CFO Viren K. Thakkar signs the accounts with the MD
- Plus business head Chetan V. Shah and 13 senior managers
| Seat | Number | Who |
|---|---|---|
| Executive | 2 | Bhadresh Shah (Chairman & MD), Yashwant Patel |
| Independent | 5 | Piyush Shah (Audit chair), Janaki Shah, Udayan Choksi, Nitin Shukla, Malay Dalal |
| Non-executive | 3 | Sanjay Majmudar, Khushali Solanki, Bhumika Shodhan |
| Signal | Read |
|---|---|
| Founder paid through dividends, not salary | Aligned with minorities |
| Chairman and MD combined since April 2026 | Weaker oversight |
| No named successor | Key-person risk |
| Independent chairs the Audit Committee | Adequate |
Management keeps its margin promises and misses its growth timelines. We model the margins and discount the timelines.
| What management said | When | What happened | Verdict |
|---|---|---|---|
| Operating margin of 24–26% as mining grows | May 2026 | 28.4% in FY26; 26.5% in H1 FY27 despite freight at 10% of sales | Delivered |
| A large grinding-media order in Chile | FY26 AR | US$32.9 mn, 18-month contract running at 3,000–3,500 t a quarter | Delivered |
| FY27 capex of ₹350–400 Cr | Aug 2026 | ₹86 Cr in H1, ₹250 Cr planned for H2 | On track |
| About 5.2 lakh t of capacity by March 2025 | FY23 AR | 4.36 lakh t; the 80 kt second phase was cut, then dropped | Missed |
| No major threat from trade barriers | FY22 AR | Duties in five countries; 75–80 kt of volume lost | Missed |
| China and Ghana plants in 1.5–2 years | Jan 2026 | On hold for another quarter (Nov 2026) | Delayed |
| NGDS breakthrough at a large mine | May 2026 | Flagship trials in Peru and Ghana delayed; one redesigned | Pending |
| Will consider how to distribute surplus cash | Aug 2026 | No decision yet; dividend flat at ₹16 since FY23 | Pending |
₹2,643 Cr went into the treasury, more than three times capex. A payout decision is the cheapest catalyst available to management.
Money owed to AIA by related parties rose from ₹55 Cr to ₹244 Cr in FY26. It is the one item in the accounts we would raise with management.
| Related party | FY25 | FY26 |
|---|---|---|
| Sales to AB Tradelink | 300.7 | 288.7 |
| Receivable from AB Tradelink | 51.4 | 158.3 |
| Commission paid to AB Tradelink | 1.2 | 1.1 |
| Receivable from Vega MPS (joint venture) | 4.0 | 85.9 |
| Total related-party receivables | 55.4 | 244.2 |
AB Tradelink is an enterprise controlled by key managerial personnel or their families. Sales to it fell 4% while the amount it owes tripled, to about 200 days of sales.
What is the price assuming?
We read the multiple against its own history and its peers, run a reverse DCF and a three-stage DCF on currency-consistent inputs, and weigh three scenarios.
- 1IndustryYes. Mines grind more rock as grades fall, and mining media is still 70–75% forged steel.
- 2CompanyYes. Four times Molycop's EBITDA per tonne, the best margins among listed peers, and liners and media tuned as one system.
- 3Why nowImport duties explain the flat years. Orders and mining tonnes have turned.
- 4ManagementTrust the margins, discount the timelines. Our base case does both.
- 5ValuationWhat is the price assuming?
- 6RisksWhat would prove us wrong?
- 7ScuttlebuttWhat does the trade tell us?
AIA trades at 28.7x earnings excluding cash, close to the bottom of its ten-year range.
AIA’s premium to mining-equipment peers is in line with its higher margin.
| Company | EV/EBITDA | Fwd EV/EBITDA | EBITDA margin | ROIC |
|---|---|---|---|---|
| Weir Group (UK) | 14.0x | 10.3x | 21.6% | 9.2% |
| Metso (Finland) | 16.9x | 12.9x | 17.6% | 12.8% |
| FLSmidth (Denmark) | 13.7x | 11.0x | 17.6% | 13.3% |
| Sigdo Koppers (owns Magotteaux) | 6.4x | – | 13.4% | 7.4% |
| ME Elecmetal (Chile) | 7.8x | – | 12.4% | 6.9% |
| Molycop (Tega and Apollo deal) | 8.6x | – | 11.2% | – |
| AIA Engineering | 20.1x | 17.1x | 28.4% | 26.3% |
Across these companies, each extra point of margin adds roughly half a turn of EV/EBITDA, and AIA sits on that line. The Molycop price shows what a lower-margin forged business is worth. AIA earns 2.5 times its margin and four times its EBITDA per tonne.
Twelve brokers published after Q2, with a mean target of ₹4,160. Our base case is 4% above it, on lower earnings than theirs.
| FY27E | FY28E | FY29E | |
|---|---|---|---|
| Consensus (Bloomberg, 12 estimates) | 128.5 | 143.2 | 158.0 |
| Our base case | 112.4 | 134.4 | 155.6 |
| Difference | −13% | −6% | −2% |
Today’s price implies 7.7% annual volume growth, below management’s plan of about 10%.
Both bars come from the same model. The bear inputs are a 12% WACC, 3% price growth, a 25.5% margin and working capital at 45% of new sales. Ours are an 11% WACC (from a measured beta of 0.65), 4–4.5% price growth, a 28% margin, 35% working capital and a five-year fade before the terminal value.
7.7% a year is below management’s FY28–29 plan and close to the duty-adjusted history. Over a decade it needs AIA to gain about 10 points of share in a 2 Mt pool that its largest rival is itself converting.
Our base case values AIA at ₹4,334 in November 2029, 36% above today’s price.
FY27 volume is flat, as guided. FY28–29 sit at the low end of the 25–30 kt plan, then volume growth eases from 7% to 5% by FY36, and revenue growth fades to 5.5% over FY37–41. Capex is ₹375 Cr in FY27 including the head office, plus the Kerala brownfield in FY30–31. Cash earns 7% before tax and is valued at book.
| DCF value in Nov 2029 (half weight) | |
| 30x FY30 core EPS plus FY29 cash (half weight) | |
| Base-case target | |
| Dividends, FY27–29 | |
| Annual return |
On the group’s strictest assumptions AIA is worth less than the price today, but over three years it roughly holds its value. That bounds the downside.
| Assumption | Base | Stress test |
|---|---|---|
| WACC | 11.0% | 11.5% |
| Rupee price growth | 4–4.5% | 3% |
| Working capital, % of new sales | 35% | 45% |
| Terminal growth | 5.5% | 4% |
| Return on new capital after FY41 | about 47% | 11.5% (= WACC) |
| Exit P/E | 3-yr value | A year |
|---|---|---|
| 30x (our base exit) | ||
| 24x (Dolat’s multiple) | ||
| 21x (our bear exit) |
The bear case loses 23% and the bull case gains 76%: 3.4 rupees of upside for each rupee of downside.
FY27 flat, then 3.5% a year; 25.5% margin; 21x exit; 12% WACC. This matches the midterm sell case.
- Annual return
- FY30 volume285 kt
Low end of the 25–30 kt plan; 28% margin; 30x exit; 11% WACC. No NGDS wins assumed.
- Annual return
- FY30 volume331 kt
NGDS converts two or three large mines; 11% growth; 29% margin; 35x exit, the ten-year median.
- Annual return
- FY30 volume357 kt
Change the assumptions to see what today’s price requires.
What would prove us wrong?
Two thirds of sales cross an ocean, and the growth depends on mines that take years to convert. We list what would break the case and the number that would tell us.
- 1IndustryYes. Mines grind more rock as grades fall, and mining media is still 70–75% forged steel.
- 2CompanyYes. Four times Molycop's EBITDA per tonne, the best margins among listed peers, and liners and media tuned as one system.
- 3Why nowImport duties explain the flat years. Orders and mining tonnes have turned.
- 4ManagementTrust the margins, discount the timelines. Our base case does both.
- 5ValuationLess growth than the business is set to deliver: 7.7% a year at a ten-year-low multiple.
- 6RisksWhat would prove us wrong?
- 7ScuttlebuttWhat does the trade tell us?
The call fails if mine conversions stall or duties spread to the copper belt.
| Risk | Mitigant and what we watch | |
|---|---|---|
| 1 | Trials fail and conversion stalls | The base case needs no NGDS win. We sell if mining volume is under 165 kt in FY28. |
| 2 | Duties reach the copper belt | Peru and Ghana have no local forged producer. Satellite plants in Ghana and China are the hedge. |
| 3 | Freight stays at 10% of sales | Contracts are moving to FOB plus actual freight. The normal level is 7–8%. |
| 4 | Molycop scales high chrome | Confirms demand; AIA’s cost per tonne is far lower. We watch AIA’s price premium. |
| 5 | Ferro-chrome and scrap spikes | Price-variation clauses pass costs on with a 3–6 month lag. |
| 6 | Credit terms used to win share | Credit insurance is in place. We worry if debtor days stay above 95 for two quarters. |
| 7 | Founder key-person risk | Kunal Shah already runs strategy and investor calls. We would ask for a succession plan. |
| 8 | Metal prices fall | Media are consumables. Mines cut capex long before they cut throughput. |
| 9 | Related-party receivables | ₹244 Cr owed at March 2026, up from ₹55 Cr. We sell if they rise again in FY27. |
We would sell if mining volume stays flat through FY28, if the operating margin stays below 24% after freight normalises, or if management spends the cash outside the core business.
What does the trade tell us?
We spoke to a 30-year Vega veteran about how mines convert and why they stay, and have two cement-side interviews scheduled.
- 1IndustryYes. Mines grind more rock as grades fall, and mining media is still 70–75% forged steel.
- 2CompanyYes. Four times Molycop's EBITDA per tonne, the best margins among listed peers, and liners and media tuned as one system.
- 3Why nowImport duties explain the flat years. Orders and mining tonnes have turned.
- 4ManagementTrust the margins, discount the timelines. Our base case does both.
- 5ValuationLess growth than the business is set to deliver: 7.7% a year at a ten-year-low multiple.
- 6RisksA stall in conversion or new duties on the copper belt. Both can be checked every quarter.
- 7ScuttlebuttWhat does the trade tell us?
A Vega veteran confirms the economics: high chrome can halve media use, and converting a mine takes about a year by design.
300–500 balls of 11–30% chrome grades, marked and charged into the live mill, then weighed.
Current wear rate and feed parameters. Often the longest negotiation.
2–4 months, depending on how far the mine is from India.
A full charge is 600–1,200 t, so most mines purge: replace wear with high chrome until 95% is converted, in 3–6 months.
3–6 months of measured wear against the baseline.
Technical sign-off, then purchasing. Regular orders follow.
The saving
Wear falls “up to 50%, sometimes 80% or 100%”: for example from 650 to 300–350 g of steel per tonne of ore. Throughput and power gains come second.
Where it does not work
SAG mills using 130–160 mm balls: high chrome can crack under the impact, so forged steel stays.
Who AIA competes with
Both forged suppliers and local or Chinese high-chrome makers, depending on the market.
Liners and media work as one system, customers rarely switch back, and the forged pool AIA can still convert is large.
Liner design drives how the media performs, so AIA tunes both together. “Definitely there is a benefit using both products combined together.” Customers can still buy one without the other.
An hour of mill downtime can cost a mine millions of dollars, so changing supplier means a full new trial. He has not seen a converted customer go back to forged; reversals happen for commercial or plant-politics reasons, not technical ones.
“We are basically not a manufacturer. We are a metallurgical company.” Grades keep improving, services run end to end, and liner and discharge designs are proprietary.
In the CIS region about 95% of mines still use forged media. New mines start on forged to keep project costs down, then convert once the saving is proven. “We could easily double or triple our business.”
Risks he named
Freight against local suppliers in some regions, and the difficulty of convincing mines to change anything that touches production. In cement, vertical roller mills replace balls, but AIA supplies their wear parts too.
The cement side
AIA's cement sales lead gives the same picture for India on the next slide. Customer interviews at JK Lakshmi Cement (Kalol) and an UltraTech plant are still being scheduled.
AIA’s cement sales lead: plants stay for the service, the few who leave come back, and ball mills are not going away.
“We just don’t sell or supply the components. We monitor the performance, we solve the problems.” The team tunes media and liners to each mill and sells on total cost of ownership.
The founder is an IIT-trained metallurgist, and the designs and alloys are tailor-made and patented. “Other can copy, but they cannot develop quality like AIA.” Mill makers fit AIA parts, so plants keep buying them.
Some plants move to a cheaper supplier under cost pressure, “but after certain period, they come to us.”
VRMs use less power; ball mills give a better particle size. Plants swing between the two, and many pair a ball mill with a roller press. AIA sells VRM parts too.
Growth
Cement grows 5–7% a year and AIA’s cement volume with it; “mining is, there is a huge volume.” Cement steady, mining the driver, as in our base case.
How much weight to give it
A current AIA salesperson, so not independent on loyalty. It matches the Vega interview and AIA’s reported share; customer interviews will test it.
Seven questions, one answer: AIA is a high-return franchise priced as if its growth has ended, just as it returns.
| Question | Our answer | Key evidence |
|---|---|---|
| 1Will demand for AIA's products keep growing? | Yes. Mines grind more rock as grades fall, and mining media is still 70–75% forged steel. | Copper grade down ~40% since 1991; a 2 Mt pool only 25–30% converted; Molycop targeting 200 kt of high chrome |
| 2Does AIA have a lasting edge? | Yes. Four times Molycop's EBITDA per tonne, the best margins among listed peers, and liners and media tuned as one system. | ₹48,700 EBITDA per tonne; 28% EBITDA margin against 12–13% at Magotteaux’s parent and ME Elecmetal; 35% median pre-tax ROTCE |
| 3Why has volume been flat, and why will that change? | Import duties explain the flat years. Orders and mining tonnes have turned. | 75–80 kt lost to duties, now in the base; order book ₹1,071 Cr; H1 FY27 mining tonnes +5.6% |
| 4Can management deliver? | Trust the margins, discount the timelines. Our base case does both. | Margin and capex guidance met; timelines missed; related-party receivables of ₹244 Cr to watch |
| 5What is the price assuming? | Less growth than the business is set to deliver: 7.7% a year at a ten-year-low multiple. | 7.7% implied growth; 28.7x P/E ex cash vs 35.9x median; base ₹4,334 vs street mean ₹4,160; strict-model stress test ₹3,129–3,523 |
| 6What would prove us wrong? | A stall in conversion or new duties on the copper belt. Both can be checked every quarter. | Sell if FY28 mining volume is under 165 kt or margin stays below 24% after freight normalises |
| 7What does the trade tell us? | Two insiders, one in mining and one in cement, confirm the saving, the stickiness and the year-long conversion cycle. | Ashish Trivedi (Vega, 30 years): 50–80% wear saving, ~1-year conversions, no technical reversals. AIA cement sales lead: plants stay for the service, leavers return, ball mills persist |
Buy AIA Engineering: base-case target ₹4,334 by November 2029.
The base case returns 36% over three years, with 3.4 rupees of upside for each rupee of downside. Our cost of equity is 11.1%, and the base case clears a 12% hurdle at ₹3,140 or lower. We would buy at today’s price and add below ₹3,000.
The base case assumes no NGDS win, no re-rating above the bottom quartile of the ten-year range, no buyback and no tariff relief. Each would add to the return.
| Q3 FY27, Jan 2027 | Freight back to 7–8% of sales; the Chilean mine at full run-rate; margin recovers. |
| Q4 FY27, May 2027 | Firmer FY28 volume guidance, promised for “next quarter or the quarter after”. |
| H1 FY28 | Decision on the Ghana and China plants; NGDS trial results in Peru and Ghana. |
| FY28 | Board decision on returning surplus cash. |
| FY28–29 | Volume up 25–30 kt a year; utilisation passes 70% and margins widen. |
Model detail, industry tables, interview notes and sources.
For questions after the presentation. The model behind every number is in model/aia_model.py.
Base-case DCF in full: ₹2,935 a share today, ₹4,334 in November 2029.
| Risk-free rate (India 10-year, Nov 2026) | 7.3% |
| Beta (5-year weekly 0.47; Blume-adjusted) | 0.65 |
| Equity risk premium | 5.8% |
| Cost of equity | 11.1% |
| Debt / capital | 0% |
| WACC (rounded) | 11.0% |
| PV of FY27–41 cash flows | |
| PV of terminal value (g 5.5%) | |
| Enterprise value | |
| Add net cash (31 Mar 2026) | ₹4,516 Cr |
| Value per share (9.33 Cr shares) |
Volume FY27 +1%, FY28 +9.5%, FY29 +8.5%, then 7% easing to 5% by FY36. Realisation +4–4.5% a year. Operating margin 26% in FY27, 27.5% in FY28, 28% after. Capex ₹375 Cr in FY27, ₹350 Cr in FY30–31, then 1.3x depreciation plus ₹3 Cr per kt above 85% utilisation. Working capital at 35% of new revenue. Tax 25.2%. Treasury yield 7% before tax. Revenue growth fades to 5.5% over FY37–41.
Five forces in mining media, factor by factor.
| Factor | Rating | Reason |
|---|---|---|
| Number of competitors | High | Molycop, Magotteaux, ME Elecmetal, about 20 Chinese forgers |
| Industry growth | Medium | Media use grows with ore milled, 2–3% a year |
| Differentiation | Medium | High in chrome alloys and liners; none in forged balls |
| Excess capacity | High | Molycop forged at about 70% use; AIA at 59% |
| Factor | Rating | Reason |
|---|---|---|
| Technology | High | Alloy and mill-design know-how built over decades |
| Customer references | High | Mines need a one-to-two-year trial before buying |
| Capital | Medium | About ₹2.5 Cr per kt of casting capacity |
| Trade protection | High | Duties in the US, Canada, Mexico, Brazil, South Africa |
| Factor | Rating | Reason |
|---|---|---|
| Availability | High | Forged balls hold 70–75% of mining |
| Price-performance | Medium | Forged costs half per tonne but wears faster |
| Switching cost | Medium | Both directions need trials and mill re-tuning |
| Factor | Rating | Reason |
|---|---|---|
| Concentration | High | Large global miners buy by tender |
| Cost share | Medium | Media is the second cost in grinding after power |
| Backward integration | Low | Miners do not cast their own media |
| Factor | Rating | Reason |
|---|---|---|
| Input volatility | High | Scrap and ferro-chrome swing sharply |
| Pass-through | Low risk | Price-variation clauses with a 3–6 month lag |
| Supplier base | Low | 88% sourced in India from many vendors |
Overall
An attractive market for an incumbent with converted customers, and a hard one to grow in. Buyer power and substitutes are the two forces to watch, and both weaken at a site once it converts.
Sources and credits
Company
- AIA Engineering, Annual Reports FY2021-22 to FY2025-26
- Earnings-call transcripts: 30 Jan, 26 May, 12 Aug and 3 Nov 2026
- Investor presentations, Q3 FY26 to Q2 FY27
- Screener.in and Yahoo Finance: financials, prices, shareholding
- Classmate midterm on AIA (sell case), used as the bear case
- IIMA library: Bloomberg (incl. ANR), Refinitiv, S&P Capital IQ, JPC prices, CRISIL; JM Financial, Dolat, ICICI Direct notes
Competitors and peers
- Tega Industries calls, slides and Screener data (Molycop)
- Centrum Broking, Molycop at 8.6x FY25 EV/EBITDA
- stockanalysis.com and multiples.vc: Weir, Metso, FLSmidth, Epiroc
- Business Standard, 11 Sep 2025 and 10 Nov 2025
Industry
- IEA, Global Critical Minerals Outlook 2025
- ICSG forecasts (Oct 2025) and monthly bulletins (2026)
- Reuters via Kitco (19 Jan 2026) and Capital.com (30 Oct 2026)
- The Oregon Group, copper record (8 Sep 2026)
- S&P Global, LME Week (Oct 2026)
- USITC News Release 25-065; US Commerce A-533-930 and C-533-931
- J. Min. Metall. 52A (2016); AusIMM MetPlant 2006 (Kagara)
- IBISWorld, US grinding media benchmark price (2026)
- SBI Research and Bank of Baroda on Indian bond yields (Nov 2026)
Photographs and video
- Chuquicamata mine: Diego Delso, CC BY-SA 4.0
- Ball mill, grinding room and iron foundry: Jet Lowe, Historic American Engineering Record, Library of Congress, public domain
- Container ship, Port Jersey: Eric Kilby, CC BY-SA 2.0
- Copper cathode, Sewell Museum: WeHaKa, CC BY-SA 4.0
- Chalcopyrite: Daderot, CC0
- Escondida time-lapse: NASA Scientific Visualization Studio, public domain
- Icons: Lucide, ISC licence